The big news this week is obviously the rise in interest rates.
Average 30-year fixed mortgage rates are now at 6.7% which is the highest they have been since July 2007.
So, how is this affecting the market? Here is what we notice…
There are fewer buyers in the market. Sales activity, measured by closed and pending sales, is down 30% compared to last year.
Prices, however, continue to rise. Average prices are roughly 11% higher than last year. This is driven by the market being under-supplied.
Inventory levels, as measured by months of supply, tells us we still have a Seller’s market. There is 2 month’s of supply currently for sale.
Ultimately, we expect the rise in interest rates to slow the pace of price appreciation. We believe the market will return to its long-term average of 6% per year.
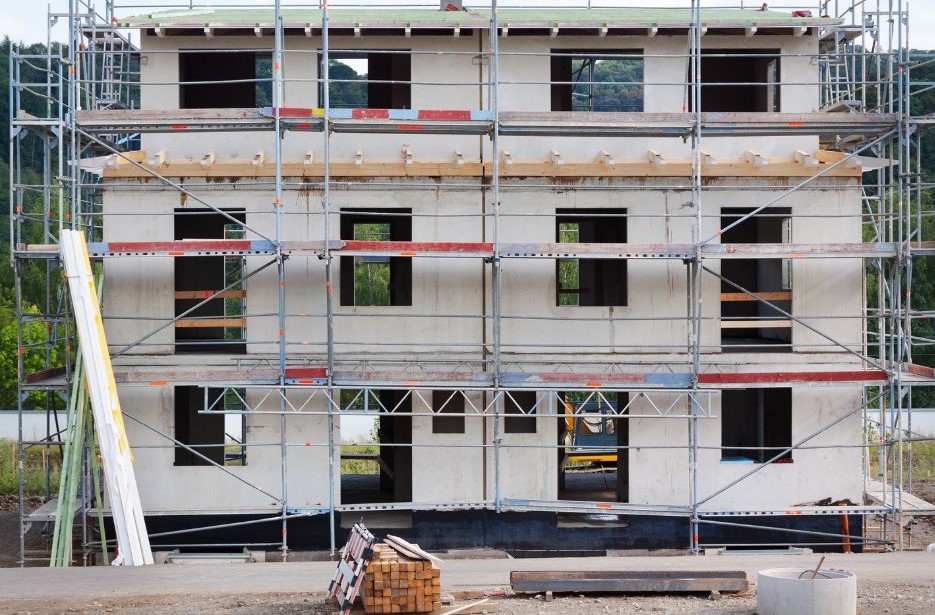
The number of new, single-family homes completed in 2022 will most closely resemble which prior year?
If you guessed 1993, you are correct.
Yes, the number of homes built and completed this year is no more than the number from 30 years ago.
In 2022, there will be just over 1 million single family homes constructed in the U.S. which is the same as 1993.
This is much more than the bottom of construction in 2011 which saw just under 500,000 new homes built.
But it is also much less than the top of 2006 which had almost 1.7 million.
Limited new home construction today is preventing anything close to a glut of inventory on the market which, in turn, insulates us from any sort of major price correction.
“I thought the market was cooling off, so why are prices still going up?”
This is a frequent question we hear from our clients.
They are understandably confused by the fact that average prices have continued to rise at a rapid pace even though sales activity is slower than what it was 6 months ago.
Bottom line, they want to know why prices are up along the Front Range anywhere from 12% to 17% compared to last year.
Firstly, we don’t expect this pace of price appreciation to continue. What we foresee is price growth going back to the long term average of 5% to 6% per year.
The reason why we still see double-digit growth comes down to two words. Supply and Demand.
Supply, while higher than a year ago, is still relatively low.
Also demand, while lower than a year ago, is still relatively high.
The market is still healthy, just not as frantic as it was.
Properties are still selling, but bidding wars and multiple offers have mostly gone away.
Sellers remain in a strong position, but they face more competition than before.
Our clients wonder what a recession would mean for the real estate market.
Many assume it would translate into a downturn in prices.
Some even worry that it would cause values to come crashing down.
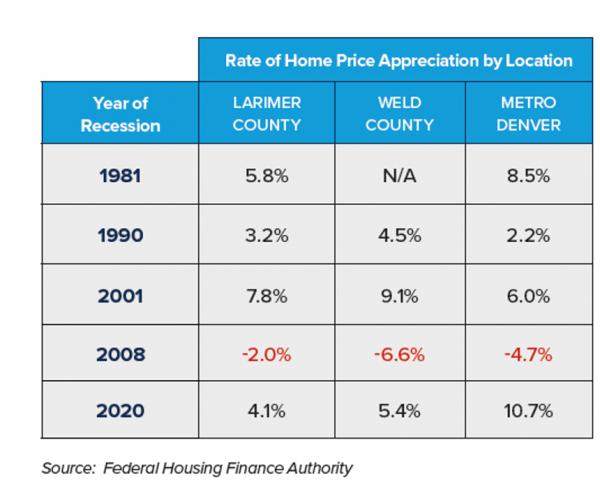
We looked back in history, at past recessions, to gain an understanding of what recessions mean for the Front Range market.
We used the extensive data from the Federal Housing Finance Authority to look at home price appreciation during the five recessions dating back to 1981.
What we found was quite interesting.
During the five recessions of 1981, 1990, 2001, 2008 and 2020, home prices along the Front Range went up in all but the 2008 recession.
What was unique about 2008 was that housing led the recession. Whereas the other recessions were triggered by some combination of inflation, oil prices, and stock market issues (plus the pandemic in 2020).
So, if the past is an indicator of the future, a recession is not guaranteed to result in lower real estate prices.
The Front Range real estate market has always demonstrated long-term health and a great resiliency to outside economic events.

 Facebook
 X
X
 Pinterest
 Copy Link