
 Facebook
 X
X
 Pinterest
 Copy Link
Months of Supply

As measured by months of supply, we have a strong Seller’s market in Northern Colorado.
Both Larimer County and Weld County measure at 1.6 months of supply.
That means, at the current pace of sales, it would take only about 6 weeks to sell all of the existing homes for sale.
The measurement becomes even more interesting when we look at specific price ranges.
Under $500,000 is 1.0 months in Larimer and 0.9 in Weld.
$500,000 to $700,000 is 1.6 months in Larimer and 2.0 in Weld.
$700,000 to $1,000,000 is 2.0 months in Larimer and 3.0 in Weld.
And, over $1,000,000 is 3.6 months in Larimer and 5.3 in Weld.
We are not surprised to see higher months of inventory in higher price ranges.
It is interesting that even $1,000,000 properties have less than 6 months.
Dropping Inventory

Breaking News – months of inventory has dropped significantly signifying an uptick in real estate activity along the Front Range.‘Months of inventory’ is an important statistic and something we commonly talk about in this blog. It simply measures how long it would take to sell all of the homes currently for sale at the current pace of sales.As a reminder, a market is ‘balanced’ when there is four to six months of inventory on the market.During the fast-paced market of June 2020 to June 2022, this statistic dropped to less than one month.During the market cooling of last Winter, it increased to over two months.Now, it is back to nearly one month of supply signaling a clear seller’s market.Of course, all markets are hyper-local and this number can vary based on specific price point and specific location.However, looking at ‘months of inventory’ from a big picture view, offers a good understanding of overall market conditions.Here is what months of inventory is for each Front Range market:Larimer County = 1.3 MonthsWeld County = 1.2 Months Metro Denver = 1.1 Months
Picking up Steam

In a market that seems abnormal to a lot of people we notice a very normal trend right now. As we head into Spring, activity is picking up.
This happens pretty much every Spring and it is happening again.
When we measure the number of properties under contract, which are set to close in the next 30 to 45 days, we see that it is significantly higher than just one month ago.
Bottom line, many more properties went under contract in March than in February. Specifically:
Larimer County is up 27% month over month.
Weld County is up 16%.
Metro Denver is up 18%.
This increase is noteworthy especially considering interest rates dropped only slightly during the month.
We expect this trend of increased sales activity to continue, as it normally does, through the Spring and into the early Summer.
No Bear

Altos Research is one of the most trusted sources of real estate market information in the United States. Each week they track every single home for sale across the Country. They analyze the pricing, supply, demand, and status changes for all listings. This amount of data allows them to expertly predict changes in the market.
Their founder, Mike Simonsen, recently said this about the current state of the real estate market:
“The most important thing to take away is that the most bearish scenarios for home prices this year are not taking place. If a buyer is sitting on the sidelines waiting for a home price crash, in general across the country that’s not happening.
“We can measure demand and the direction of future sales prices by looking at the percent of homes on the market with price reductions. This number, frankly, is lower than I would have expected given how few buyers were out in the fall. This a sign that sellers are not panicking and that smart, properly priced listings are getting their offers.”
The annual Market Forecast featuring Chief Economist Matthew Gardner is February 1st at 5:30pm. To see the details and to RSVP, visit www.ColoradoForecast.com
The Big News

The big news this week is obviously the rise in interest rates.
Average 30-year fixed mortgage rates are now at 6.7% which is the highest they have been since July 2007.
So, how is this affecting the market? Here is what we notice…
There are fewer buyers in the market. Sales activity, measured by closed and pending sales, is down 30% compared to last year.
Prices, however, continue to rise. Average prices are roughly 11% higher than last year. This is driven by the market being under-supplied.
Inventory levels, as measured by months of supply, tells us we still have a Seller’s market. There is 2 month’s of supply currently for sale.
Ultimately, we expect the rise in interest rates to slow the pace of price appreciation. We believe the market will return to its long-term average of 6% per year.
Weeks to Months

For the first time in almost two years, there is more than a month’s worth of inventory on the market.
This means that at the current pace of sales, it would take more than a month to sell all of the homes currently for sale.
This is certainly welcome news for buyers who have been craving a less frenzied market.
Since the market took off in the summer of 2020, inventory levels have been measured in terms of weeks.
Two to three weeks of inventory was the typical measurement for the last two years.
Today, inventory levels look like this:
- Larimer County = 1.1 months
- Weld County = 1.2 months
- Metro Denver = 1.2 months
Still Behind
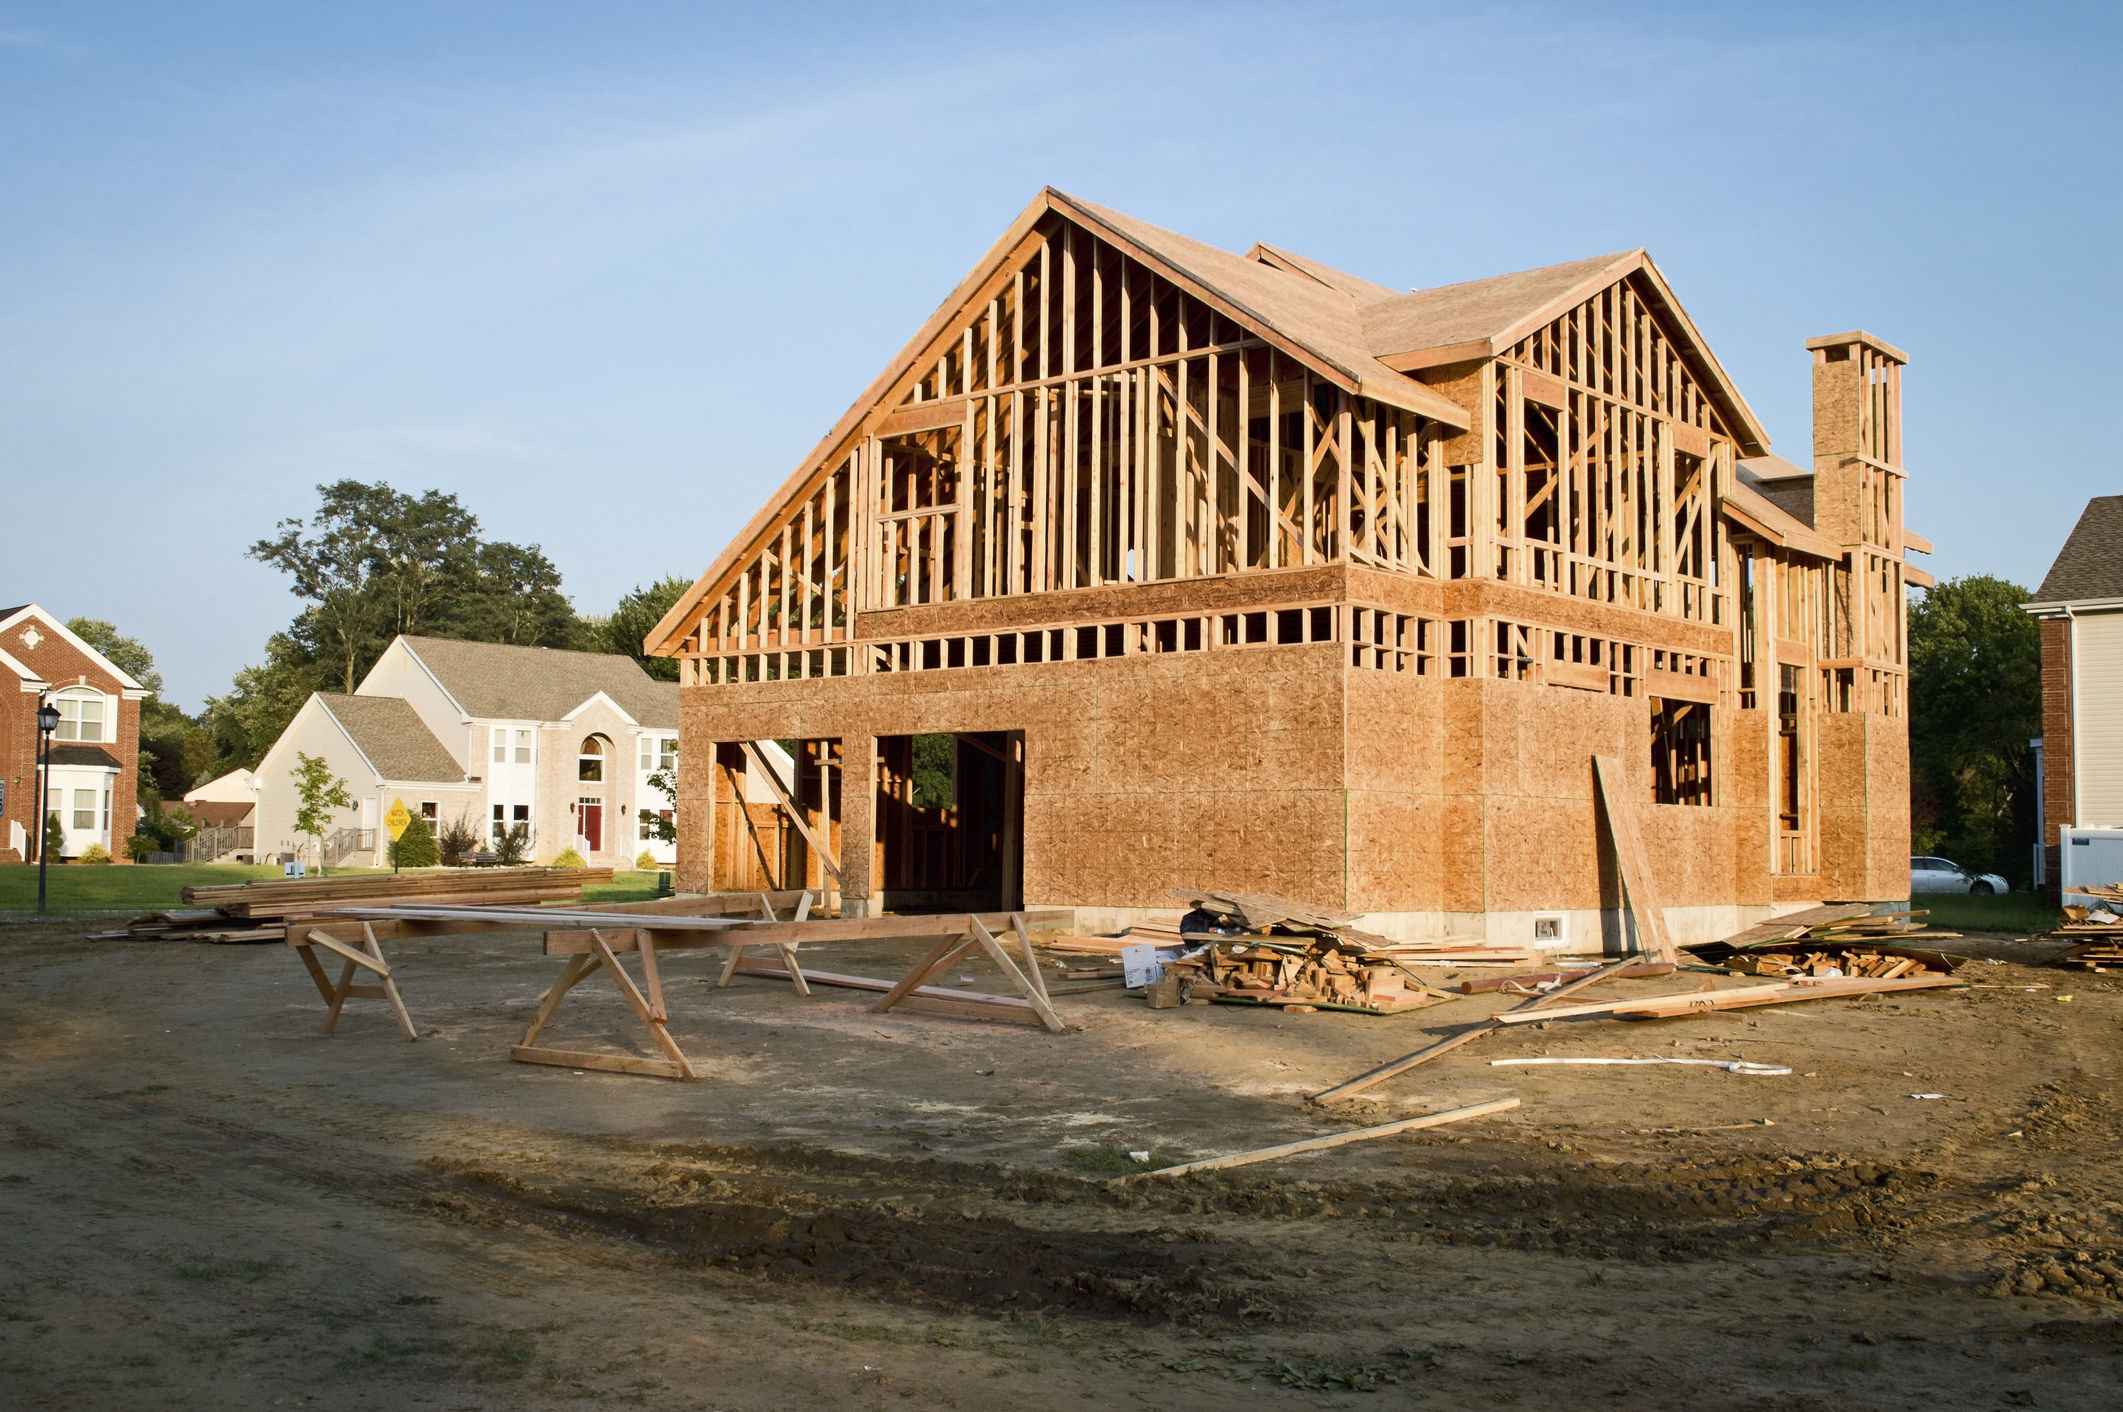
Single family new housing starts in 2022 will show an increase versus last year, will be the most since 2007, and will still be well behind the peak of 2006.
This year, experts predict that a total of 1.1 million single family homes will be started. In 2021 there were 970 thousand new home starts.
The peak occurred in 2006, when 1.65 new homes were started.
So, this year will finish 33% behind the peak.
When we are asked why today’s market is different from the ‘bubble years’ of 2004 to 2007, the difference in new home starts is one reason we cite.
Even though the market is cooling, we remain significantly undersupplied which insulates prices from any kind of dramatic downturn.
Inventory Bottom

In Front Range markets, the number of homes for sale has just hit bottom or is about to hit bottom.
This is terrific news for home buyers who have been waiting for more homes to choose from.
The market is shifting, there is no doubt about that.
Prices are still increasing and we expect them to increase, just not at the pace they have been.
The inventory of homes for sale, which has been significantly down for two years, is finally starting to show signs of change.
We have been accustomed to inventory levels being down 30% to 50% compared to the prior year.
That is not the case anymore.
Inventory in Larimer and Weld County is now only down roughly 5% year over year.
Inventory in Metro Denver is now up 13.5% compared to this time in 2021.
We believe this is a legitimate shift in the market, not just a short-term anomaly.
No need to worry about prices crashing or a housing bubble. There is still too little supply and too much demand for that to happen.
However, the pace of price of appreciation will certainly get back to more normal levels of 5% to 6% per year instead of 20% to 25% per year.
Bottom line, this market shift has been a long time coming and is very good news for buyers.
The Difference Between a Comparative Market Analysis and an Appraisal

It can be difficult for sellers to distinguish between two methods of finding the value of their home: a Comparative Market Analysis (CMA) and a home appraisal. Though they share many similarities, there are key differences in how the two approaches ultimately arrive at a listing price for your home.
The Difference Between a Comparative Market Analysis and an Appraisal
Comparative Market Analysis (CMA)
A CMA is conducted by an agent using their knowledge of the local market in conjunction with information available to them on the multiple listing service (MLS), which contains data on sold homes and market trends. A CMA helps to price the home more accurately, keeping the property competitive in the current market. For those who are thinking of selling their home For Sale By Owner (FSBO), it’s worth noting that you will not be able to conduct a CMA on your own, since, among other things, access to the MLS is exclusive to real estate agents.
Your agent’s analysis accounts for the various factors that influence home prices to arrive at an accurate estimate of your home’s value. A CMA compares your home to others in your area that have either recently sold, are currently on the market, or had previously listed but have since expired, typically using data from the past three-to-six months. Comparable homes, or “comps,” are homes whose characteristics are similar to your own, such as the housing type, condition, and the square footage and property size. A thorough CMA will provide information on what homes in your area are selling for, how long they were on the market, and the difference between their listing and sold price, and will list a low, median, and high selling price for your home.
Appraisal
The main difference between an appraisal and a CMA is the personnel involved. Whereas a CMA is conducted by a real estate agent, an appraisal is carried out by a licensed appraiser on behalf of the bank. Once a buyer applies for a loan to purchase your home, the bank will order an appraisal of the property. Though appraisers use methods of comparison similar to an agent’s CMA, unlike a real estate agent, bank appraisers have no vested interest in the sale of the home. The goal of an appraiser’s visit is to determine your home’s fair market value to ensure that the bank isn’t lending more money to the buyer than needed.
For more resources on the selling process and to use our free home value calculator, visit the selling page on our website here:
Fall Perspectives 2018: Our Pledge To You

Posted in Perspectives by Jill Jacobi Wood, OB Jacobi & Geoff Wood

Change is afoot. We suppose it always is, but doesn’t it all seem to come at us so much faster in today’s world? We see change all around us. Just consider, for a moment, how much technology has changed our lives thanks to innovators like Uber, Google, and Apple, to name a few. Technology has also changed the way we do real estate.
The real estate world is a complex environment that most of us only travel once every 10 years. This infrequency, coupled with the ever-changing laws and emotional toll, makes it very hard for most of us to navigate. That’s why we rely on a professional. Even those of us who live and breathe real estate every day use a Windermere agent to conduct our personal transactions.
Thanks to technology, certain aspects of the real estate process that were once difficult are now very easy, like searching for a home. Within minutes of a property being listed, it’s fed to websites all over the world for potential buyers to see. Information about neighborhoods, schools, and home values are also readily available online to help buyers make smart decisions.
There’s no doubt that real estate will continue to benefit from technology, but we’re concerned about the companies that are beginning to look at consumers less as people and more as data that can be generated and shared for monetary gain.
At Windermere, our agents don’t treat their clients like data points being fed into an algorithm; they know them on a personal level. They help buyers make one of the biggest financial and emotional decisions of their lives. They help sellers understand the nuances of the market so they can get top dollar for their home. They are experts in neighborhoods, market trends, contracts, and negotiations. They treat their clients with respect and compassion. And they care deeply about their local community.
As the saying goes, the more things change, the more they stay the same. Real estate is the perfect example of that. Technology will continue to change and improve how people buy and sell homes, but our pledge to you is that it will never replace what has always mattered most to us: relationships.
– OB JACOBI, JILL JACOBI WOOD, AND GEOFF WOOD
