
 Facebook
 X
X
 Pinterest
 Copy Link


The following analysis of the Metro Denver & Northern Colorado real estate market is provided by Windermere Real Estate Chief Economist Matthew Gardner. We hope that this information may assist you with making better-informed real estate decisions. For further information about the housing market in your area, please don’t hesitate to contact your Windermere agent.
REGIONAL ECONOMIC OVERVIEW
The job recovery that appeared to be firmly in place in the summer has started to wane. Though Colorado has recovered more than 209,000 of the jobs lost due to COVID-19, employment levels remain almost 210,000 below the level seen last February. Even with employment growth stalling, the unemployment rate stands at a relatively respectable 6.4%, down from a peak of 12.2%. Regionally, unemployment levels range from a low of 5.4% in Boulder to a high of 6.9% in Greeley. Rising COVID-19 infection rates continue to impact the job recovery, and I do not see much in the way of palpable improvement until a vaccine becomes freely available, likely in the second half of this year.
COLORADO HOME SALES
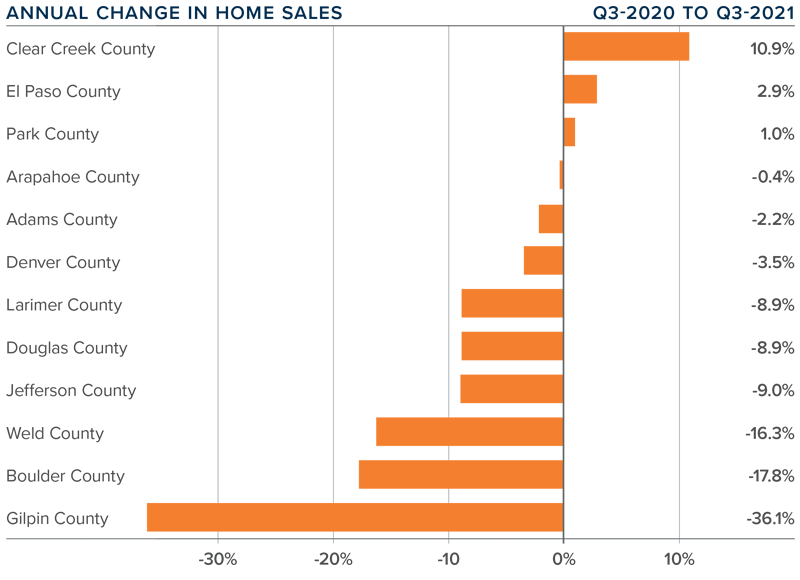
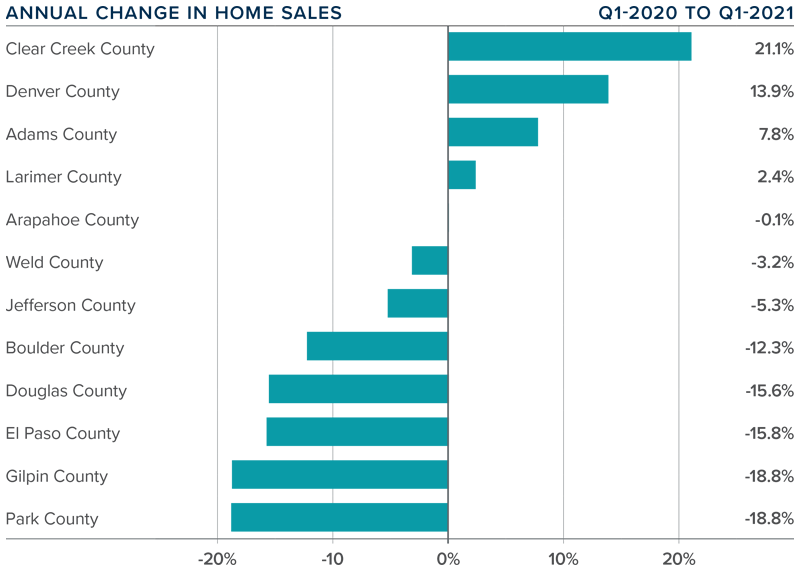
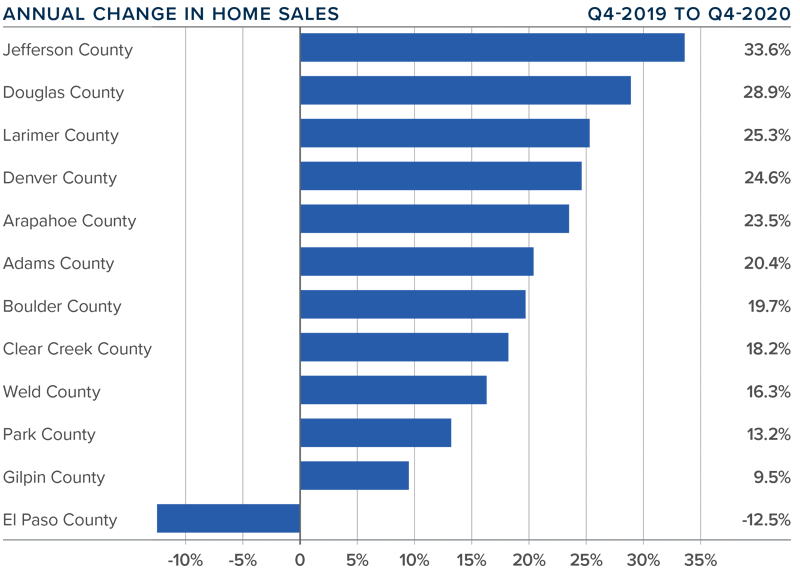
❱ In the final quarter of 2020, 12,207 homes sold. This represents an increase of 21.8% compared to the fourth quarter of 2019, but 19% lower than in the third quarter. I am not concerned, though, because seasonal influences tend to impact sales in the winter.
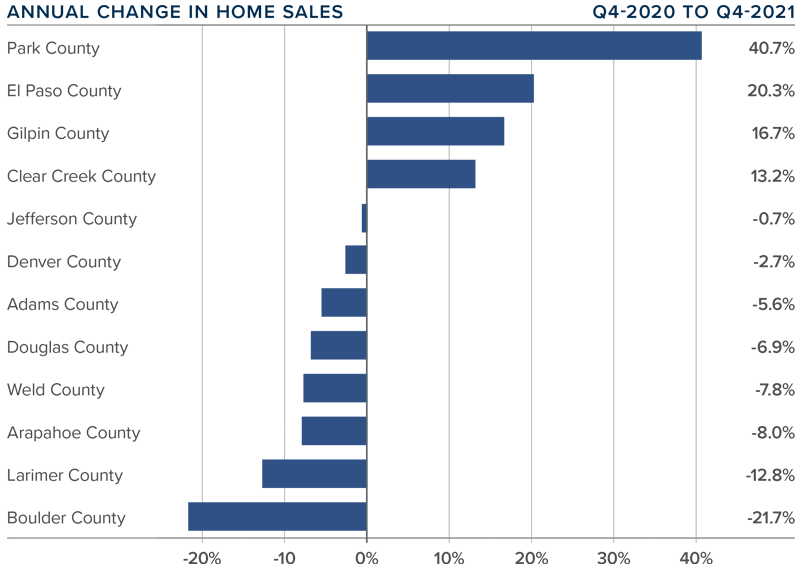
❱ Sales rose in all markets other than El Paso compared to the fourth quarter of 2019. I believe sales are only limited by the number of homes on the market.
❱ Inventory levels remain well below what I would like to see. The average number of homes on the market in the fourth quarter was down 55% from the same period in 2019.
❱ Pending sales were 34% lower compared to the third quarter. Again, seasonality and a lack of homes to buy impact this figure. Pending sales are still 13% higher than a year ago.
COLORADO HOME PRICES
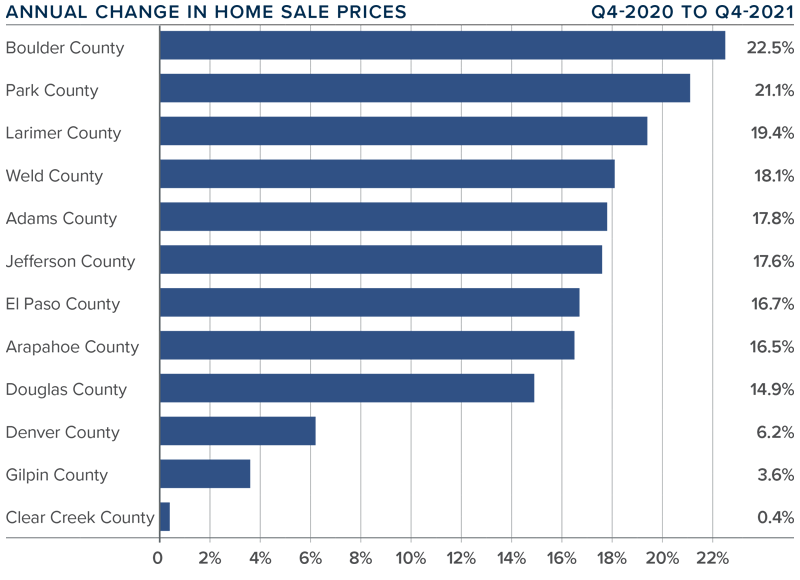
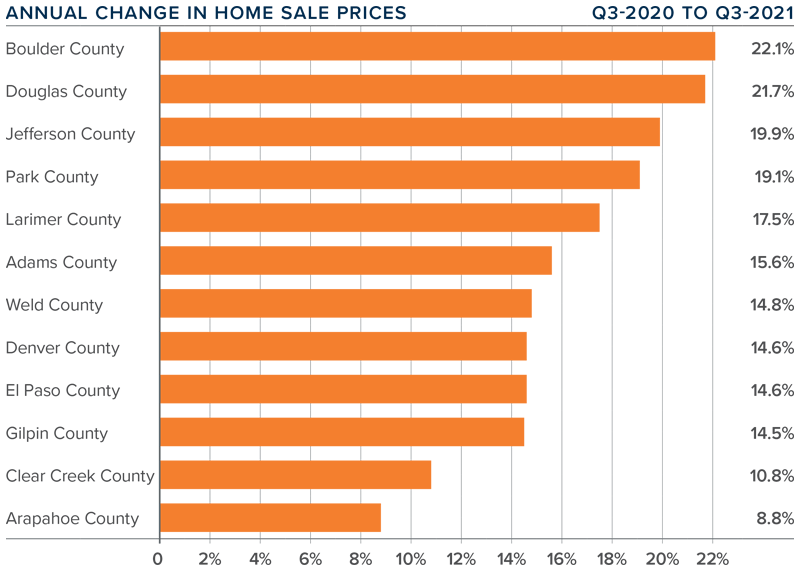
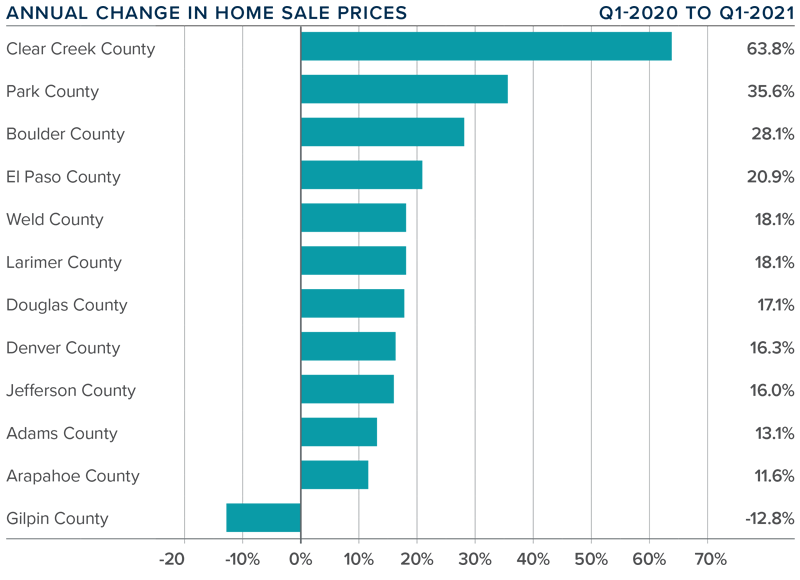
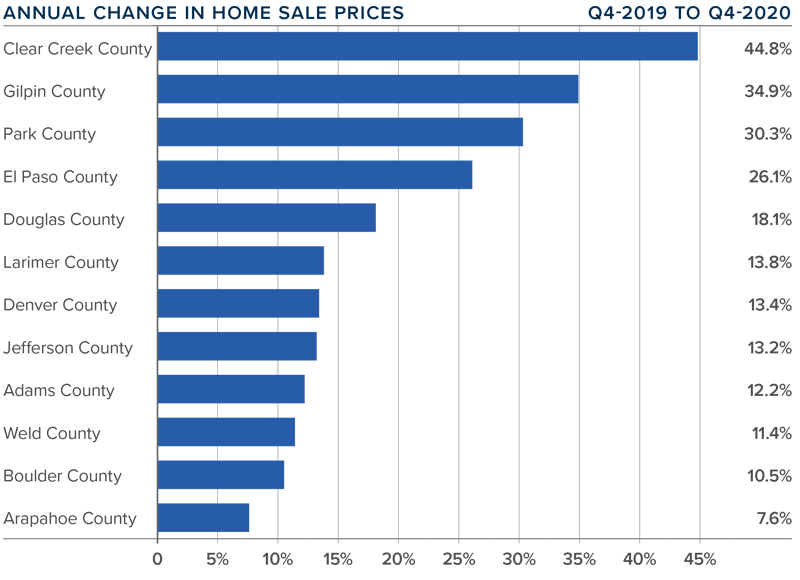
❱ Home prices rose significantly in the fourth quarter, with the average price increasing 13.7% year-over-year to $532,492. Prices were up 1.8% compared to the third quarter of this year.
❱ Interest rates are unlikely to drop much further and this will lead price growth to slow as we move through 2021.
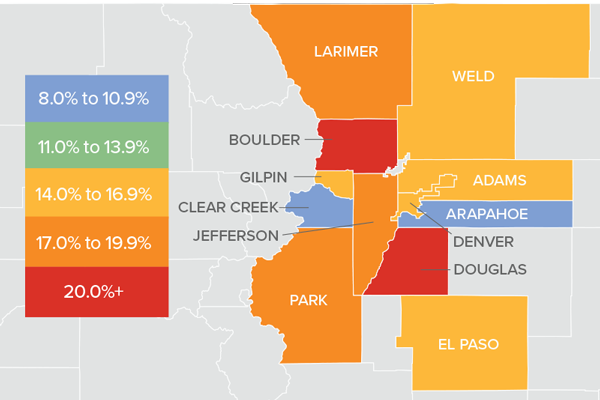
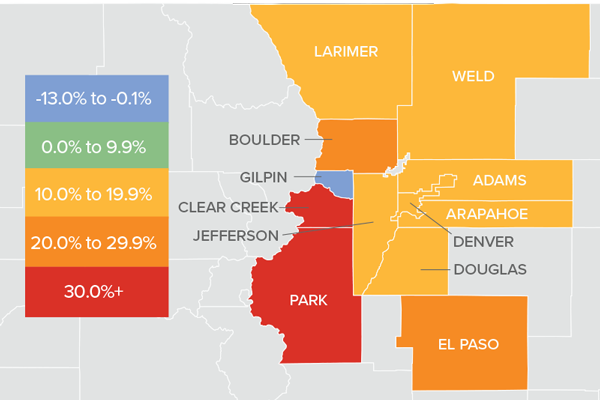
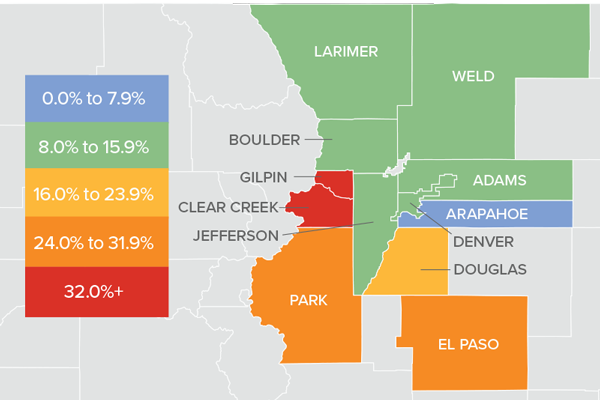
❱ Year-over-year, prices rose across all markets covered by this report, with significant appreciation in Clear Creek, Gilpin, Park, and El Paso counties. Every county but Arapahoe saw double-digit price gains.
❱ Affordability in many Colorado markets remains a concern as prices continue to rise at well-above-average rates. That said, I anticipate we will see price growth moderate in 2021.
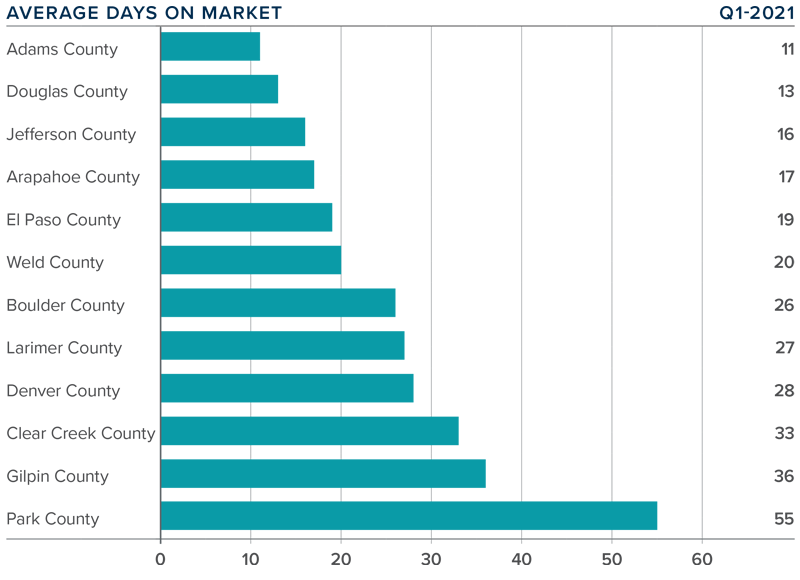
DAYS ON MARKET
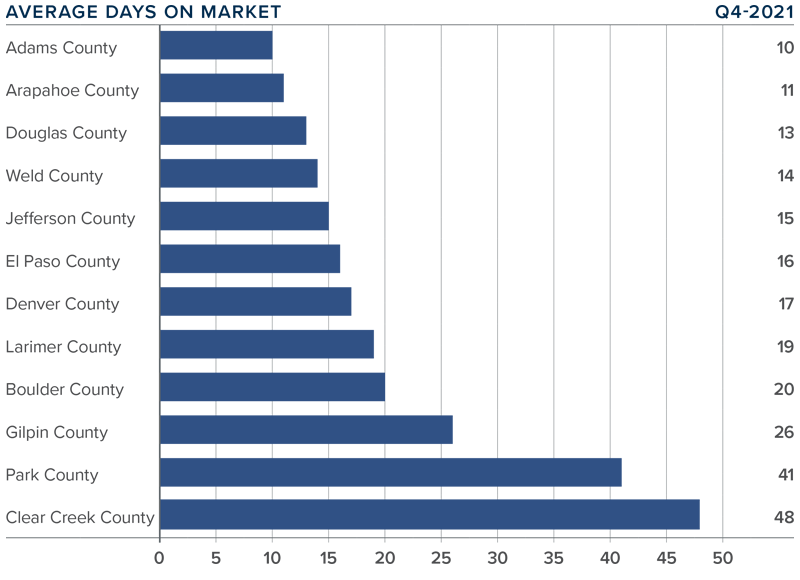
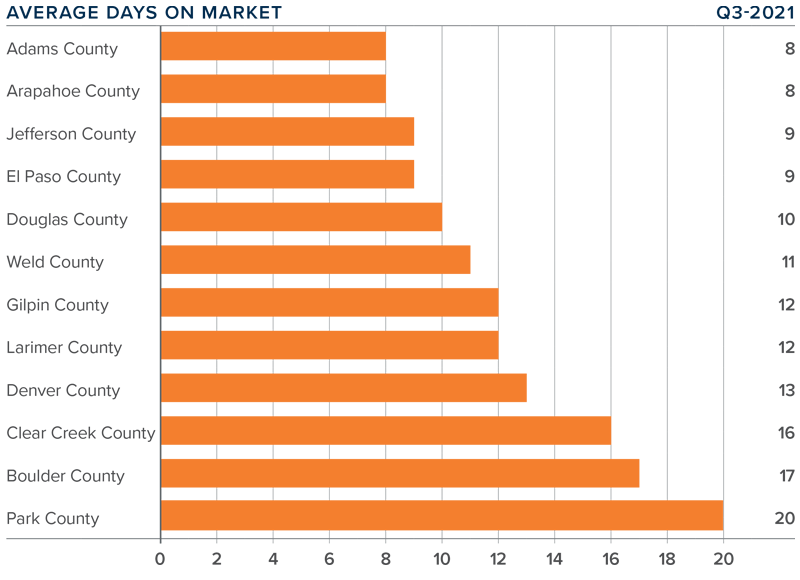
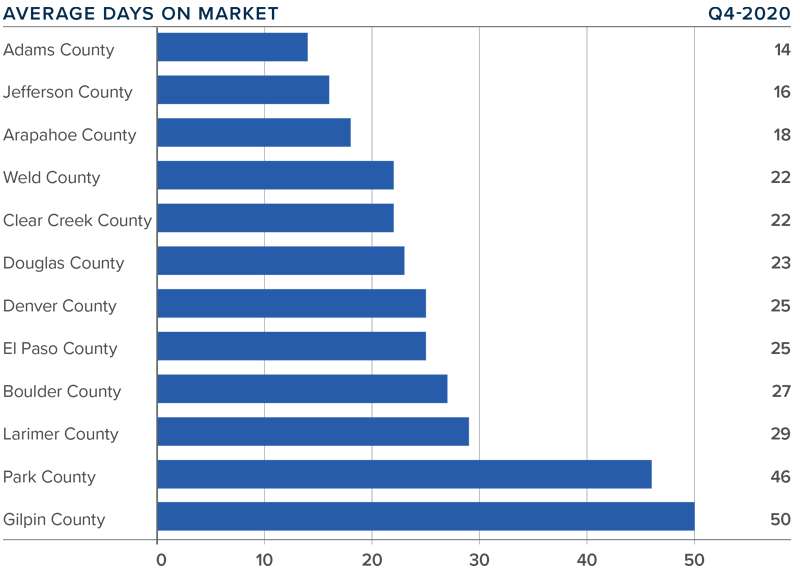
❱ The average number of days it took to sell a home in the markets contained in this report dropped 15 days compared to the final quarter of 2019.
❱ The amount of time it took to sell a home dropped in every county contained in this report compared to the fourth quarter of 2019.
❱ It took an average of 26 days to sell a home in the region, down 3 days compared to the third quarter of 2020.
❱ The Colorado housing market continues to demonstrate solid demand, and buyers are clearly competitive as suggested by the short length of time it is taking to sell a home.
CONCLUSIONS

This speedometer reflects the state of the region’s real estate market using housing inventory, price gains, home sales, interest rates, and larger economic factors.
Home sales and prices are significantly higher than a year ago, and demand for housing is very much in place. Naturally, this favors home sellers who are still in control of the market. I do expect to see some improvement in listing activity this year, which, in concert with modestly rising interest rates, will likely start to take some of the steam out of the market. However, any moderation in the market has yet to appear. Even given the possible headwinds mentioned above, I am moving the needle a little more in favor of sellers, as demand is likely to exceed supply for the time being.
ABOUT MATTHEW GARDNER

As Chief Economist for Windermere Real Estate, Matthew Gardner is responsible for analyzing and interpreting economic data and its impact on the real estate market on both a local and national level. Matthew has over 30 years of professional experience both in the U.S. and U.K.
In addition to his day-to-day responsibilities, Matthew sits on the Washington State Governors Council of Economic Advisors; chairs the Board of Trustees at the Washington Center for Real Estate Research at the University of Washington; and is an Advisory Board Member at the Runstad Center for Real Estate Studies at the University of Washington where he also lectures in real estate economics.


 This speedometer reflects the state of the region’s real estate market using housing inventory, price gains, home sales, interest rates, and larger economic factors.
